
Karl Pearson published the chi-square test more than 120 years ago, in a paper about how well observed counts fit what a theory expects. It is one of the oldest tools in statistics that people still use every day, next to the z-test for proportions and the sample size formulas that go with them. Age has not made them better understood. Survey advice still repeats "you need 385 responses" as if it were a law of nature, A/B testing dashboards still paint a 25% lift green on a few hundred visitors, and chi-square results still get reported as "highly significant" without a word about how strong the association is.
This article takes seven beliefs about sample size, significance and counts and checks each one with a number. Every figure was run through the z-test calculator, the chi-square calculator and the sample size calculator. Six of the beliefs are false or only half true. One is exactly right, and it is not the one most people would guess.
The scorecard first
The table gives the verdict and the single number that settles each belief. Everything below it is the reasoning.
| Belief | Verdict | The number that settles it |
|---|---|---|
| 385 responses are enough for any survey | Half true | 1,068 at a ±3 point margin |
| A bigger population needs a much bigger sample | False | 370 for 10,000 people, 382 for 50,000 |
| A 25% lift on the dashboard is a real lift | False | p = 0.0769 at 1,000 visitors per arm |
| A z-test and a chi-square test give the same answer on an A/B table | True | z = 2.502, chi-square = 6.260 = z² |
| Significant means the lift is as big as it looks | False | 95% interval: +0.54 to +4.46 points |
| A tiny p-value means a strong association | False | p = 5.00 × 10-41, V = 0.294 |
| Checking the test every day costs nothing | False | about 19% false alarms with ten looks |
"385 responses are enough for any survey"
Half true
The number is real. It is what you get from the survey formula with a 95% confidence level, a margin of error of plus or minus 5 percentage points and the most cautious guess about the answer, a 50% split: the z value for 95%, 1.95996, squared, times 0.5, times 0.5, divided by 0.05 squared, is 384.15, and sample sizes are always rounded up. That is where 385 comes from.
The trouble is the word "any". Change one assumption and the number moves a lot. Tighten the margin to plus or minus 3 points and the same calculator asks for 1,068 responses. Ask for 99% confidence at plus or minus 5 and it is 664. Those are not exotic settings. A margin of 5 points means a reported 52% could really be anywhere from 47% to 57%, which is too wide to call most close questions.
And the 385 only covers the whole sample. If the report will break results down by men and women, or by four regions, each subgroup needs its own margin. Four regions at plus or minus 5 points each is roughly four times 385, not 385.
"A bigger population needs a much bigger sample"
False
This one surprises almost everyone. Beyond a few thousand people, the size of the population barely matters. What drives the sample size is how precise you want to be, not how many people you are describing. The finite population correction only bites when the sample would be a noticeable slice of the whole, roughly above 5%.
The table runs the same settings, 95% confidence, plus or minus 5 points and a 50% split, through the sample size calculator for populations from 100 to 50 million. The ready-made pages for a population of 1,000, a population of 10,000 and a population of 50,000 open the calculator with these settings filled in.
| Population | Responses needed | Share of the population |
|---|---|---|
| 100 | 80 | 80% |
| 500 | 218 | 44% |
| 1,000 | 278 | 28% |
| 5,000 | 357 | 7% |
| 10,000 | 370 | 4% |
| 50,000 | 382 | 0.8% |
| 50,000,000 | 385 | 0.0008% |
A town of 10,000 needs 370. A city of 50,000 needs 382. A country of 50 million needs 385. The small populations are where the correction earns its keep: a company with 100 employees needs 80 answers, not 385, which is just as well, because it only has 100.
The flip side is uncomfortable for small groups. Surveying 80 out of 100 is 80% of everyone. If response rates are low, a small organization may simply not have enough people to reach a plus or minus 5 point margin, and the honest move is to report a wider margin rather than pretend.
"A 25% lift on the dashboard is a real lift"
False
Picture a test where version A converts at 10% and version B at 12.5%. That is a relative lift of 25%, the kind of result that gets a slide of its own. Whether it means anything depends almost entirely on how many visitors saw each version. The z-test calculator runs the same two rates at five amounts of traffic:
| Visitors per arm | z | p, two-sided | Verdict at 0.05 |
|---|---|---|---|
| 800 | 1.582 | 0.1136 | not significant |
| 1,000 | 1.769 | 0.0769 | not significant |
| 1,200 | 1.938 | 0.0526 | not significant |
| 2,000 | 2.502 | 0.0124 | significant |
| 4,000 | 3.538 | 0.0004 | significant |
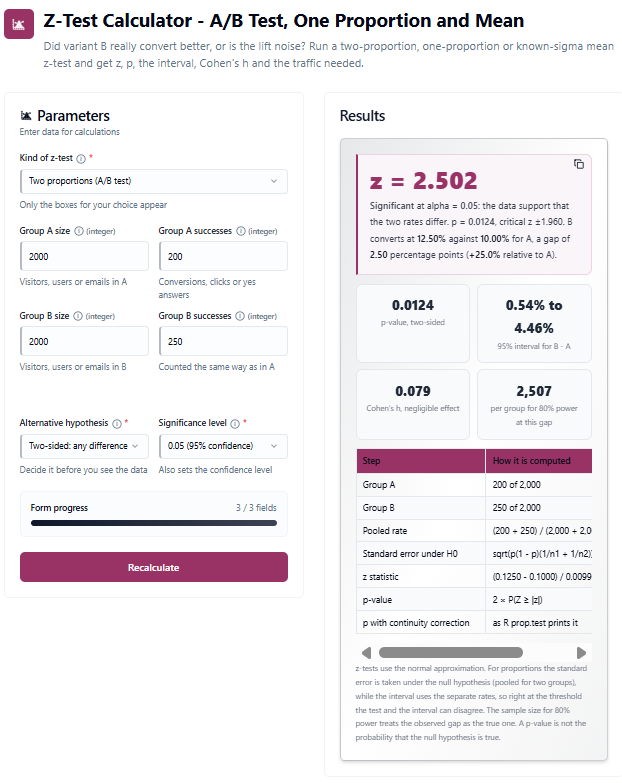
At 1,000 visitors per arm the p-value is 0.0769. At 1,200 it is 0.0526, close enough to tempt anyone. Only at 2,000 per arm does the same 25% lift clear the bar, with p = 0.0124. The rates never changed; the evidence did. The z-test calculator also prints the traffic that would have been needed to detect a gap of this size 80% of the time: 2,507 per arm.
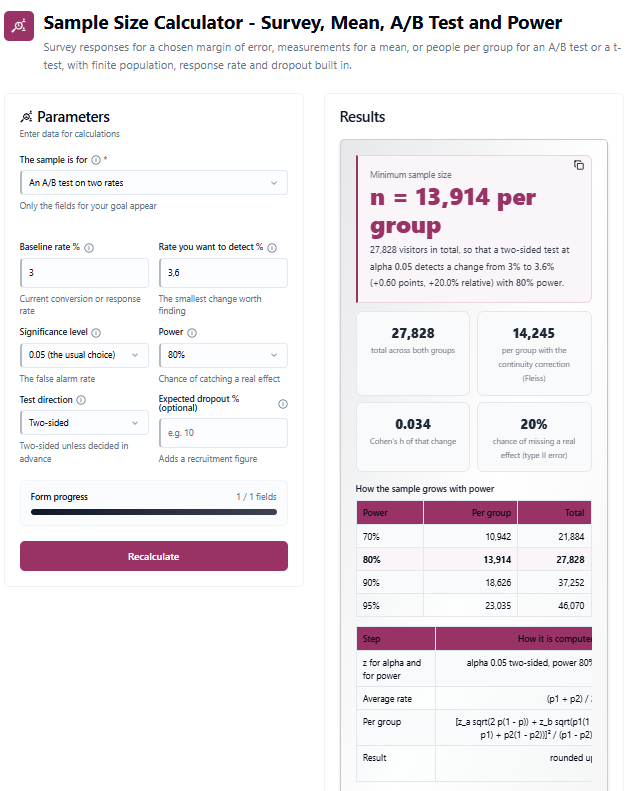
Smaller baselines make it worse. Lifting a 3% conversion rate to 3.6% is the same 20% relative lift as many dashboards celebrate, and the sample size calculator says it takes 13,914 visitors per variant, 27,828 in total, to detect it with 80% power. Most small sites never collect that much traffic in a single test, which is exactly why so many of their "winning" variants quietly stop winning after launch.
"A z-test and a chi-square test give the same answer on an A/B table"
True
This is the one belief on the list that holds, and it holds exactly: for a two-by-two table, the z-test for two proportions and Pearson's chi-square test are the same test. Put the A/B result above into the chi-square calculator as a table, 200 1800 on one line and 250 1750 on the next (conversions and non-conversions), and it returns chi-square = 6.260 with p = 0.0124. Square the z of 2.502 and you get 6.26. Same p, to four decimals.
So when two tools disagree on a two-by-two table, the tests are not the reason. The usual suspect is the continuity correction. R's prop.test and chisq.test apply Yates' correction by default for two-by-two tables, and most online A/B calculators do not. On this table the corrected p is 0.0142 instead of 0.0124. Both calculators print the corrected figure next to the plain one, so you can match either convention. What the z form adds is the one-sided test and a confidence interval for the difference; what the chi-square form adds is that it keeps working with three or more rows and columns.
"Significant means the lift is as big as it looks"
False
Back to 2,000 visitors per arm and p = 0.0124. The observed gap is 2.5 percentage points. The 95% confidence interval for that gap, printed right next to the p-value, runs from 0.54 to 4.46 points. On a 10% baseline that is anything from a lift of about 5% to a lift of about 45%.
Significance answers one narrow question: is the gap unlikely to be zero? It says almost nothing about whether the gap is 5% or 45%, and those two numbers lead to very different business decisions. A redesign that pays off at a 25% lift may not be worth the engineering time at 5%. Report the interval, and plan with its lower end, not with the point estimate.
"A tiny p-value means a strong association"
False
The Titanic passenger and crew records that ship with R count 2,201 people by class and by whether they survived. Paste the four rows into the chi-square calculator and the p-value is 5.00 × 10-41, a number so small it is hard to picture. It would be easy to conclude that class and survival were almost perfectly linked.
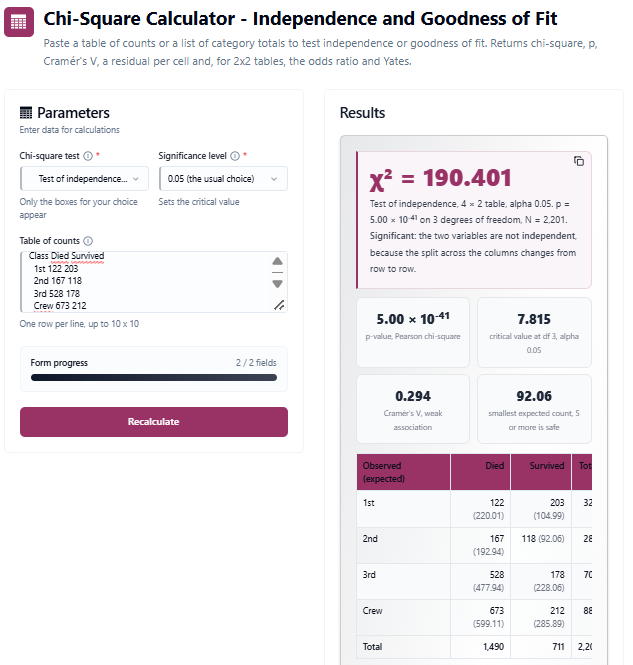
They were not. Cramér's V, the effect size for a table like this, is 0.294, just under the 0.3 that Cohen's rule of thumb uses for a medium effect. The calculator labels it a weak association. The p-value is tiny because 2,201 people is a lot of evidence, not because the link is overwhelming. With enough data, a small effect produces a p-value with forty zeros.
The useful part of the output is further down. The adjusted residuals show where the table departs from independence: first-class survivors carry an adjusted residual of +12.59, far more than independence would predict, and crew survivors -6.87, far fewer. That tells you where the story is. The p-value only tells you there is a story.
"Checking the test every day costs nothing"
False
This is the belief that does the most damage, because it feels like diligence. The test runs, someone opens the dashboard every morning, and the day p dips below 0.05, the test is stopped and the winner shipped. Each individual look uses a 5% threshold, so it seems the error rate stays at 5%.
It does not. Every extra look is another chance for random noise to cross the line, and once it has crossed, the test stops, so the noise never gets the chance to cross back. The effect was worked out decades ago by Armitage, McPherson and Rowe for repeated significance tests on accumulating data, and a simulation with no real difference between the versions reproduces their figures:
| Looks at the data | Chance of a false winner |
|---|---|
| 1 (planned, analyzed once) | 5% |
| 2 | about 8% |
| 5 | about 14% |
| 10 | about 19% |
| 20 | about 25% |
Ten looks, about 19%. Twenty looks, about 25%, five times the rate the dashboard claims. The fix is dull and effective: decide the sample size before the test starts, with a calculator rather than by feel, and analyze once when it is reached. If you genuinely need to look early, use a sequential design built for it, which spends the error budget across the looks on purpose.
What the seven have in common
Every false belief on the list comes from reading one number without the ones around it. The 385 without its margin and confidence level. The 25% lift without the traffic. The p-value without the interval, or without the effect size, or without the number of times someone peeked. The calculators print those neighboring numbers on purpose, next to the headline figure, because the headline alone is where the mistakes live. The one belief that held up, the z-test and chi-square agreeing on a two-by-two table, is the exception that proves the pattern: it is a statement about two formulas, not about what a single number means.
Planning a survey or an A/B test in the right order takes three steps. Decide what precision or what smallest effect would change your decision. Run the sample size calculator with that. Collect the data, analyze it once, and report the interval and the effect size along with the p-value.
Tools discussed in this article
- Z-test calculator: two proportions for an A/B test, one proportion against a benchmark with an exact binomial p, or a mean with a known sigma; prints the continuity-corrected p, the interval and the traffic needed for 80% power.
- Chi-square calculator: independence in a table of counts pasted from a spreadsheet, or goodness of fit to equal shares or a ratio such as 9:3:3:1, with Cramér's V, adjusted residuals, the G-test and the odds ratio for two-by-two tables.
- Sample size calculator: survey responses for a margin of error with the finite population correction and response rate, measurements for a mean, visitors per variant for an A/B test, and participants per group for a t-test using exact t power.
More statistics tools
P-value (a p from any z, t, chi-square or F) · One-sample t-test (a mean against a target) · Two-sample t-test (two group means, Welch or paired) · Fisher's exact test (small 2x2 tables) · Z-score (one value against a mean and SD) · Wilcoxon test (rank tests for skewed data) · Pearson correlation (the r between two columns) · Linear regression (a line through paired data) · R squared (how much a model explains) · Skewness (how lopsided a list is) · Kurtosis (how heavy its tails are) · Interquartile range (quartiles and outliers) · Coefficient of variation (spread as a share of the mean) · Percentile (where a value sits in a list) · Mode (the most frequent value) · Percentage (lifts and shares in percent) · Standard deviation (the spread a sample size plan needs)